Agent 1: Habit Tracker
The habit tracker helps me monitor daily routines, visualize long-term progress, and stay accountable. Here are my key takeaways from building and using it:
- Tracking 3–4 habits per day strikes a good balance between consistency and sustainability.
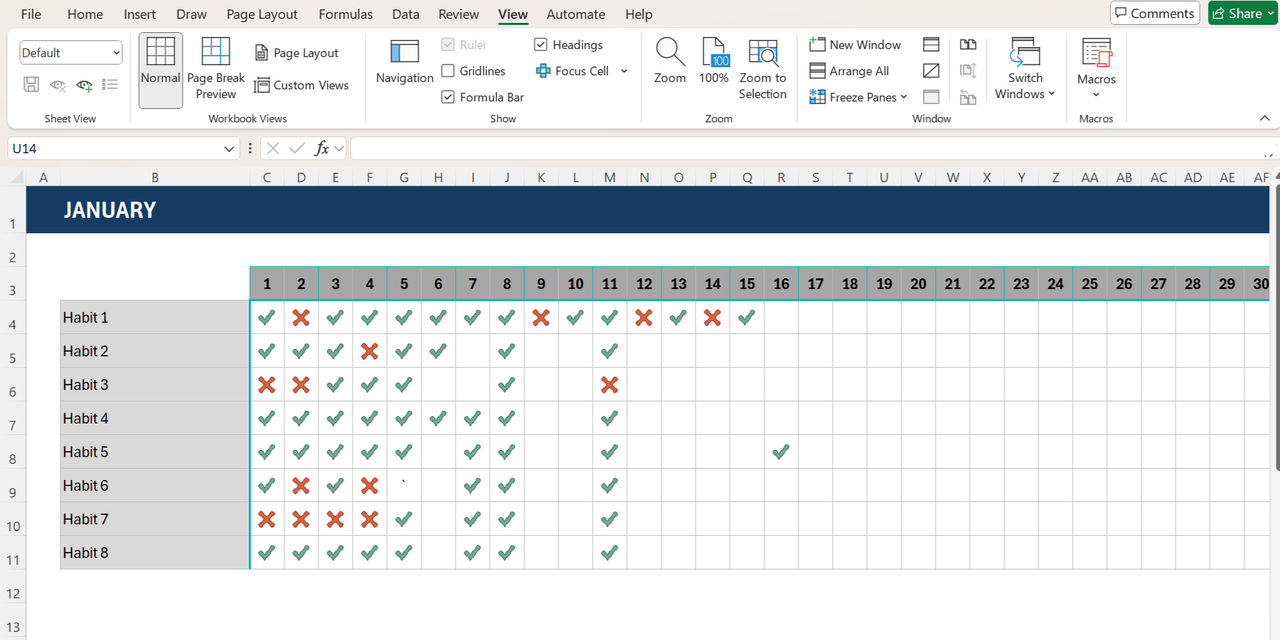
- I built a 12-month tracking sheet with organized tables for each day of the year.
- Functions like
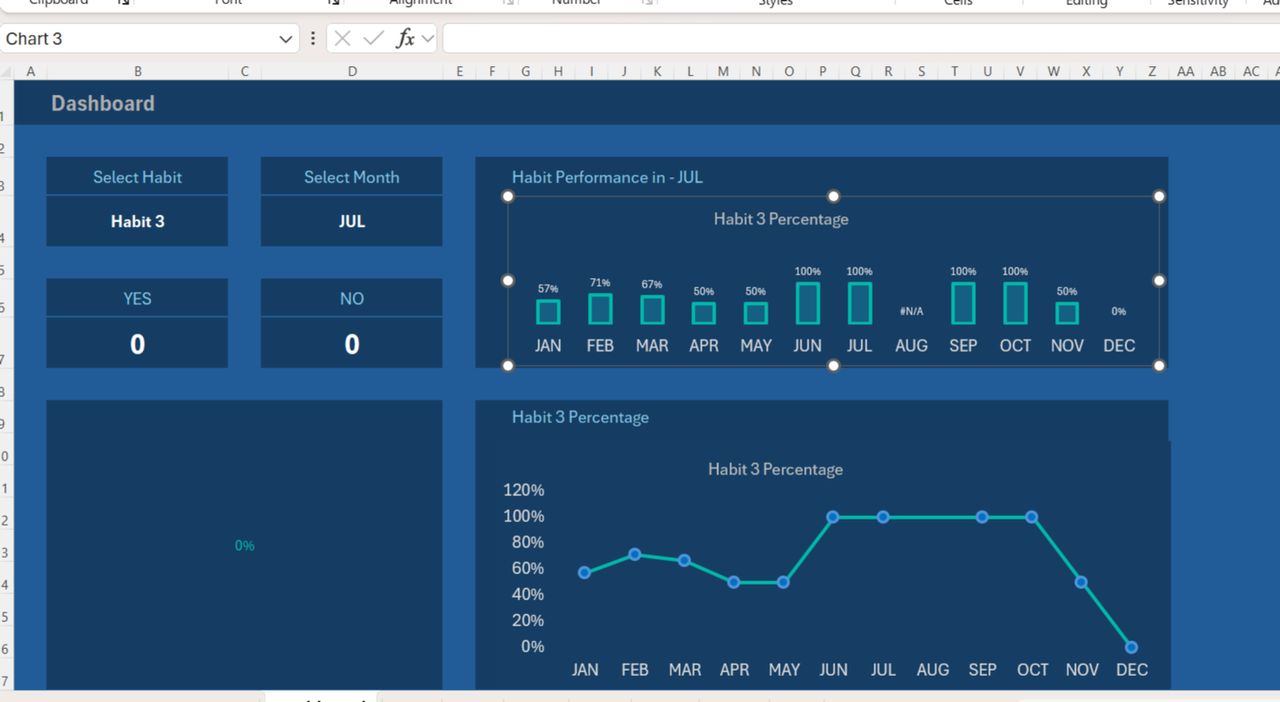
COUNTIFandHSTACKwere used to summarize daily and monthly results per habit. - An interactive dashboard displays habit success rates for quick performance insights.